
Financial Astrology: Vesta as a Primary Indicator
By Michael O’Reilly
Financial analysts have long recognized that the stock market moves in cycles, and some investors have managed to profit by taking advantage of these somewhat regular troughs and peaks. It’s only one of many factors that well-paid financial advisers use when considering what stocks to buy and sell for themselves and for their clients. Technical and fundamental analyses provide the main tools for these experts.
As in other branches of astrology, financial astrology has its share of eccentric techniques. To be sure, translating the symbols on the chart into making profitable trades requires getting down to what really works and discarding the rest. Surprisingly, transiting Neptune and Pluto play much smaller roles than one might expect, while transiting Jupiter, Saturn, and Uranus are usually behind the really big price moves.
Financial astrology requires a high level of astrological knowledge, and among the primary tools you’ll need is how to interpret secondary progressions. Astrology software programs can do all the calculations, but understanding orbs of influence is critical to stock market timing. Solar progressions just don’t hold a candle to secondary progressions.
One of the surprising keys is the asteroid Vesta. In my some two dozen financial astrology books, Vesta is mentioned only twice, yet she is often a major factor when a stock makes strong moves, either up or down. And Vesta also plays a prominent role in the market’s long-term trends and periodic crashes. So here’s a deeper look.
Vesta in Market Horoscopes
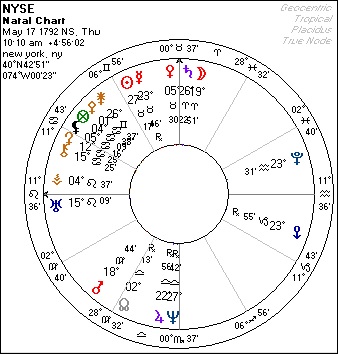
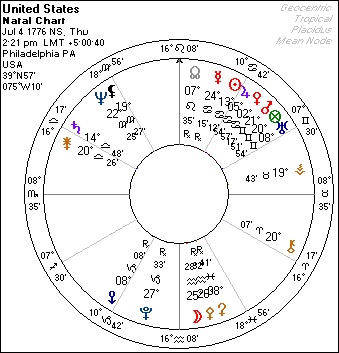
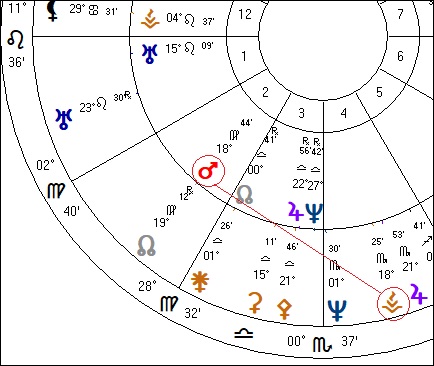
The following is based on my experience and research: I use the Scorpio Rising chart for the U.S. (July 4, 1776; 2:21 pm; Philadelphia) and I’ve found that 10:10 am for the signing of the Buttonwood Agreement works well for the NYSE (May 17, 1792; New York, NY).
In this pivotal position, Vesta activated can lead to bull markets, which in turn leads to business optimism and wage growth. For example, in 2017 and 2018 transiting Pluto has been trine Vesta, which has kept the stock market heading upward in spite of being nine years into a long-term bull. The U.S. is experiencing a corresponding record low in unemployment, with more jobs available than people looking for work.
The record for the longest bull market began just after the so-called “Flash-Crash” on October 19, 1987. At the time, the U.S. progressed Vesta was at 27º35’ Taurus, or just 0º02’ past the exact trine to the U.S. Pluto. This bull lasted until March 2000 when progressed Vesta was at 29º Taurus and over half a degree beyond its trine to progressed Pluto at 28º Capricorn. In other words, its positive influence had peaked, leaving the market trends open to other, more bearish influences.
And as a way of helping to verify the Scorpio Rising national chart, the Flash-Crash took place when transiting Pluto was conjunct the Scorpio Ascendant. Pluto here is a solid indicator for panic setting in. This set-up is augmented by transiting Black Moon Lilith squaring the Scorpio Ascendant. (Lilith is another little-used, but prominent indicator, but that’s another story….
Transiting Jupiter at the time was exactly squaring natal Mercury, providing some help and a quick return to normalcy. But the key here is progressed Vesta’s favorable connection to the U.S. natal and progressed Pluto which provided the astrological framework for the longest bull market in U.S. history. For a wide-ranging but brief introduction to progressions visit my webpage on the subject here.
I invite you to check out the outer planet transits and progressions to this U.S. chart when the Crash of ’29 was underway on October 26, 1929. As now, transiting Pluto was making a harmonious sextile to natal Vesta, and also a sextile to Neptune, bridging the two, and showing the widespread fascination for making money in the market. However, the progressed chart shows the indicators that led to the catastrophic collapse.
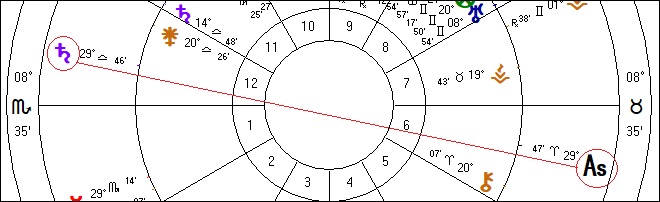
Most importantly, the progressed Ascendant at 29º Aries opposed progressed Saturn at 29º Libra at the time of the Crash. Also, transiting Pluto opposed the progressed Midheaven over the following months, bringing further financial losses and pain. These precise bearish indicators are true if and only if one uses the Scorpio Rising U.S. horoscope.
NYSE
Turning now to the NYSE chart, I wasn’t quite sure that the chart used here was the correct one until early 2018. Financial astrologers use a variety of horoscopes to track the markets, including one for the Dow Jones Industrial Averages, the Nasdaq, and various times for the Buttonwood Agreement on May 17, 1792. However, this gathering of traders just after our nation was getting started provides the foundation for the various market indices, and so becomes the dominant chart for tracking the stock market.
A time of 10:10 am puts 11º Leo on the Ascendant, a point which was hit by a Total Lunar Eclipse on January 31, 2018. The transiting Moon and Ceres were exactly conjunct at 11º Leo with the Sun at 11º Aquarius, with all three perfectly aligned with the NYSE Leo Ascendant. Until this eclipse, the Dow, Nasdaq, and S&P were consistently and steadily marching upward, and setting a record for new record highs along the way.
Two days after the Lunar Eclipse, the Dow fell 666 points, its worst decline in two years. Until that precipitous decline, the market moved only fractionally day after day, and generally up. Traders had been lulled into a sleepy stupor, thinking that the tiny daily moves were the new norm. The apparent trigger was Friday’s disappointing labor report.
But then the next trading day, Monday February 5, the Dow went into a freefall, plunging 1600 points before it recovered to a loss of 1175, but still the worst one-day loss in history. Something had clearly changed, but the news wasn’t particularly unusual or unsettling. The only explanation was the astrological shift in the NYSE, marked by the Lunar Eclipse which activated a confluence of other factors, including Vesta’s conditions.
Vesta in the NYSE chart is located at 4º Leo where it gains relevance and weight by squaring Venus at the Midheaven. Vesta is also in the same degree as the Part of Fortune, which is at 4º Cancer, so that any outer planet transit or progression at 4º influences “fortunes” which in turn relates to investments (Vesta). Vesta is also octile (45º) Mars, a combination that implies how trading action relates to investment strategies.
Among the stressful astro-events taking place on February 5 was transiting Uranus nearing the NYSE’s Midheaven and conjoining Saturn at 26º Aries. The Great Awakener would be in play over the next few months, which kept market timers guessing. The small daily moves had suddenly transitioned into huge daily moves, both up and down, creating the sense of extreme volatility that we associated with Uranus.
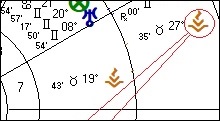
Other factors included transiting Pluto opposite the progressed Moon, and transiting Saturn opposite the Part of Fortune and quincunx Vesta. Transiting Mars at 4º Sagittarius was the trigger planet on Friday, activating all these heavy duty astro-events. Vesta by secondary progression was at 22º Scorpio and less than a degree from progressed Jupiter at 23º Scorpio. This extremely favorable combination promised a return to strong market conditions, which were well under way by June with a series of new record highs.
Looking back to this bull market’s beginning in March 2009, the NYSE chart again provides the red and green flags that indicate the key turning points in market trends. In mid-September 2008, the collapse of Lehman Brothers and the potential collapse of other huge banks “too big to fail” led to a series of market mini-crashes over the next few months, and finally a bottom on March 9, 2009. From that point onward, the stock markets began a steady climb into record territory and the second longest bull market in history.
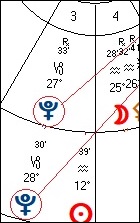
Many astrologers have noted that Pluto’s entry into Capricorn around then corresponded to the global financial collapse. But in September, Pluto was still at 28º Sagittarius. And as it happens, the NYSE’s progressed Sun was also at 28º Sagittarius, and this is the unmistakable signal of the severe downturn. Of course, a single astro-event doesn’t cause such major changes. Another major red flag was transiting Uranus opposite Mars, a classic signature for increased volatility.
And when the market finally hit bottom on March 9, 2009, Vesta played a major role in signaling a return to better days. Transiting Uranus had finished opposing natal Mars and was entering into a sextile to natal Mercury. And now progressed Vesta at 18º Scorpio was applying to a gung-ho sextile to natal Mars at 18º Virgo. This aspect became exact over the following year as the market nearly doubled in value.
Financial astrologers have missed the boat by not considering Vesta in their analyses. Only a handful has acknowledged this asteroid as being relevant, and these include Christeen Skinner who refers to Vesta as “the trading asteroid”. A few others, including Arch Crawford and Bill Meridian, have referred to a 1985 study on the Vesta-Mars cycle. It was initially published in Great Britain and notes that trading according to the Mars-Vesta cycle outperforms the buy-and-hold strategy by two to one.
For long term investors, having accurate U.S. and NYSE horoscopes will considerably help you decipher market trends.
One of the surprising keys in financial astrology is the asteroid Vesta. In the dozens of books on financial astrology books, Vesta is rarely even mentioned, yet she is often a major factor when a stock makes strong moves, either up or down. And Vesta also plays a prominent role in the market’s long-term trends and periodic crashes. Here’s a deeper look.
Vesta in the
U.S. and NYSE Horoscopes

The material on this page is excerpted from the November 2018 issue of Dell Horoscope magazine. For further info, visit dellhoroscope.com

If Vesta occupies a prominent place in your chart, and especially if it’s aspecting Mars, you may do well in the investment world. A prominent Vesta by itself may indicate this, and all the more so if it’s in your 2nd, 5th, 8th, or 10th houses. Vesta in the 6th house can refer to working in the investment or wealth-management business. Vesta aspecting Fortuna, Venus, Jupiter, or the Sun is especially favorable for making lots of money in investments.
For questions, comments or other feedback, email Michael O'Reilly at wolfstar3@aol.com